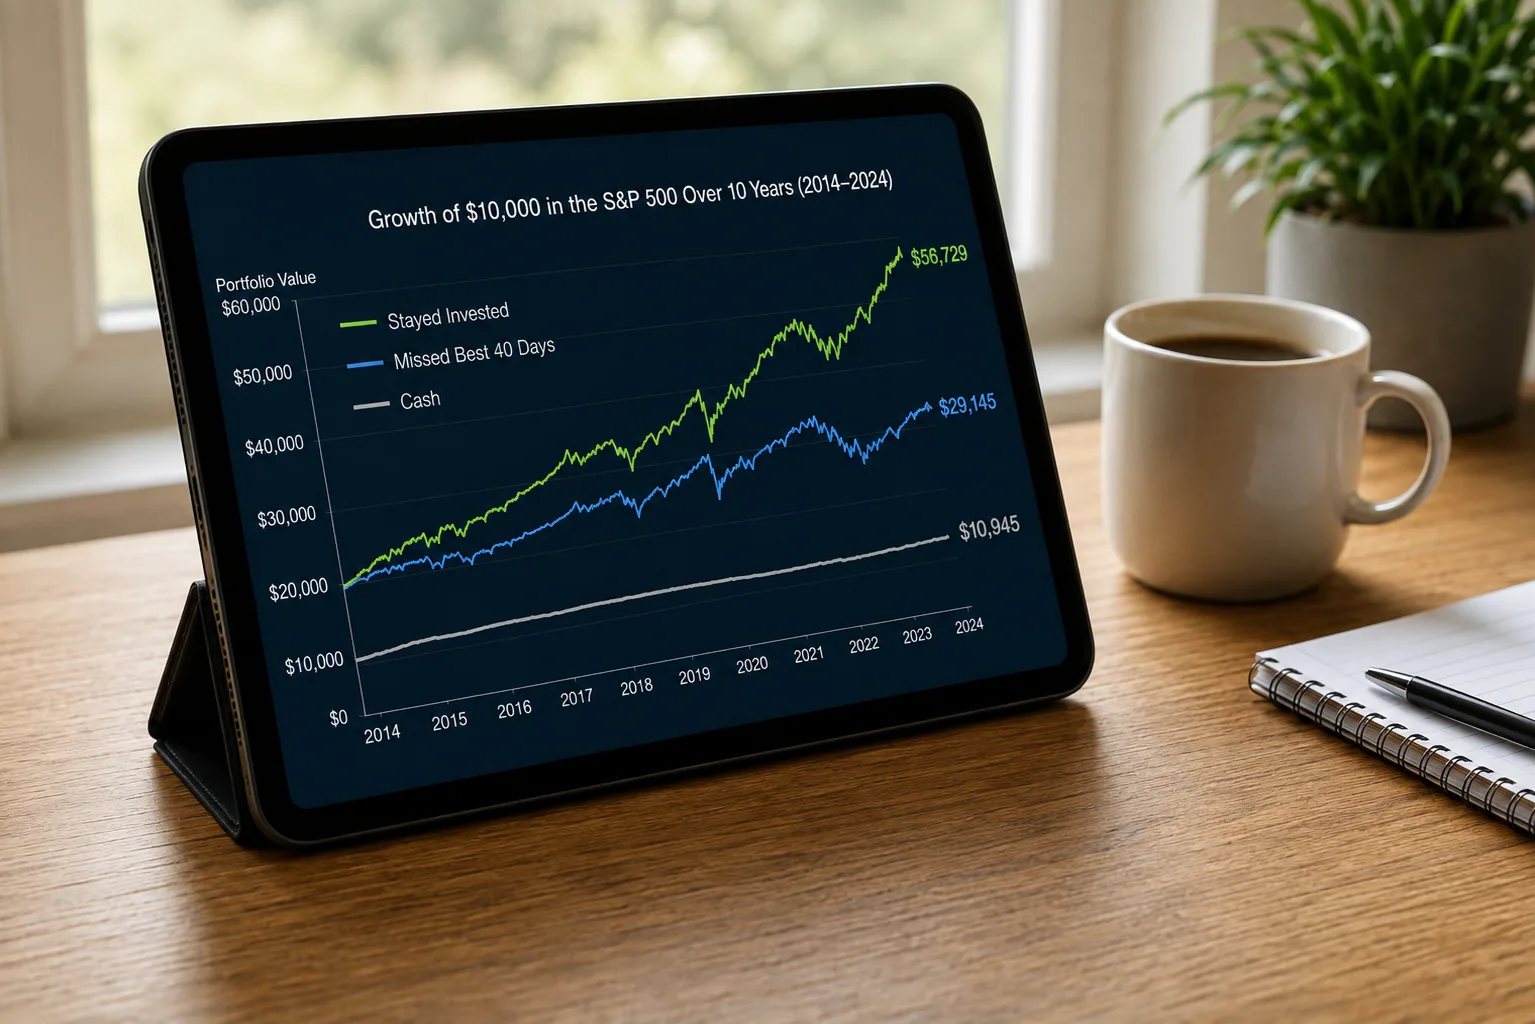
Two investors can hold the same index fund over the same ten years and finish with very different balances.
What separates them is a few dozen trading days: the sessions when the market rose most, and whether their money was invested through them. One widely cited study measured that gap over the decade from 2009 to 2018.
$1,000 Grew to $2,775, or to $712 With the 40 Best Days Missed
The study followed a hypothetical investor who put $1,000 into the S&P 500 index on January 1, 2009 and held through December 31, 2018.
It then recalculated the result if that investor had been out of the market for the 10, 20, 30, and 40 best-performing days of the decade.
| Days Sat Out | Value of the $1,000 at the End of 2018 | How It Compares |
|---|---|---|
| None | $2,775 | Full period invested |
| The 10 best days | $1,722 | 62% of the fully invested result |
| The 20 best days | $1,228 | 44% of the fully invested result |
| The 30 best days | $918 | A decline of 8% from the original $1,000 |
| The 40 best days | $712 | A decline of almost 29% from the original $1,000 |
No one can buy the S&P 500 itself; the practical version is an index mutual fund or ETF that tracks it, and a fund holder's decade would come out close to these numbers.
The line to watch in the table is where a smaller gain turns into a loss. Missing the 10 best days still left the investor ahead of where they started. Missing 30 left them behind it.
Time in the Market Means a Holding Period, Not a Frozen Portfolio
"Time in the market" is the length of the holding period, whatever the holdings happen to be. Technically that stretch could be days or weeks, but in practice the phrase describes longer-term investors.
A retirement account opened with a first paycheck and left alone until the last one spans most of a working life, and often keeps running after the paychecks stop.
What it does not mean is buying one asset and never touching it again. Long-term investors commonly:
- Route new contributions into a holding that suits the plan they already have
- Rebalance every so often, pulling the mix of holdings back toward the allocation they're aiming for
- Drop an asset class that has stopped serving its purpose, or one that hasn't measured up to the standard they set for it
The distinction, then, isn't between activity and inactivity. A long-term investor holds a portfolio for years and adjusts it occasionally. A timer decides when to be in the market at all and when to sit in cash.
Market Timing Tries to Beat the Average Return by Picking Entry and Exit Points
Whatever form it takes, market timing aims at an annual return above the market average, earned by catching highs and lows at the right moment.
That happens at two scales. With a single holding, the judgment is about price rather than the business behind it: the position gets opened while the quote looks too low and closed once it doesn't, and the gap between the two prices is the payoff.
With a whole portfolio, the judgment is about exposure, in the market now and out of it later. Some investors make those calls on their own read of conditions, others on past performance data or analytical forecasts.
That goal is what makes the approach demanding. It takes research and regular monitoring of markets and individual holdings, which is one reason professional portfolio managers and asset management firms find consistent timing hard to pull off.
An investor who isn't watching daily has more room to end up on the wrong side of a move.
Selling in a Downturn Locks In the Loss and Creates a Second Decision
Market drops rarely arrive with an explanation attached. Prices fall on news nobody had planned for, a surprise election outcome or an emergency order that shuts businesses down, and the instinct is to sell before things get worse, especially for someone near retirement who can't absorb a large loss, or a newer investor with no experience of a crash.
The trouble is that selling into a downturn books the loss, or at least a reduced return, and then leaves the money sitting in cash. That raises a question the sale didn't answer: when to get back in.
The 2008 crash is the usual reference point, and what made it expensive for some investors was the sale rather than the decline. A loss that exists on paper stays reversible; a loss that has been sold is finished, and the cash it raised only goes back to work when somebody decides to put it there.
The rally came in early 2009. Some of the money raised during the deepening volatility of the Great Recession bear market, selling that press accounts attributed to fear, was still sitting in cash by then, so the recovery ran its course without those portfolios in it. For some investors, the shortfall pushed their retirement date back.
Frequent Trading Adds a Tax Cost, and Sometimes a Trading Cost
Active timing carries expenses that a longer holding period doesn't. A security sold at a profit less than a year after purchase produces a short-term capital gain, and short-term gains are taxed on the same schedule as ordinary income.
Once the holding passes the one-year mark, any gain falls under the long-term capital gains rates, which are usually lower. The same dollar of gain can therefore carry a bigger tax bill purely because of when the sale happened.
Transaction fees used to bite harder. Many online brokerages now offer low-cost or no-cost trading, so fees weigh on frequent traders less than they once did.
Where the Account Is Held Changes the Tax Side of the Math
One practical wrinkle the raw comparison skips: the capital gains issue applies to taxable brokerage accounts. Trades inside tax-advantaged retirement accounts are generally not taxed at the time of the sale, since those accounts have their own rules for when money is taxed.
The same trading pattern can therefore carry a very different tax consequence depending on which account it happens in. That's easy to miss when strategies get compared purely on returns.
What Compounding Explains, and What the Best-Days Data Doesn't
The argument for staying invested rests on compounding: holdings that stay in place have more time to build on themselves, and the reasoning assumes the market tends to move higher over long stretches. The approach is common among financial advisors, and asset managers often build around it.
Warren Buffett has long spoken in favor of it. The best-days exercise itself has been rerun many times over the years, with the same general conclusion. Still, no strategy guarantees future results, and past performance in a study covering one particular decade isn't a forecast of the next one.
It's also worth being clear about what the best-days data does and doesn't say. It measures the cost of being out of the market on specific high-return days. It doesn't claim that a timer would inevitably miss exactly those days, and it doesn't score any real investor's actual record.
The Two Approaches Differ in Effort as Much as in Outcome
Set side by side, the two approaches ask different things of the person running them, and they put different weight on getting single decisions right.
Timing needs ongoing research, daily attention, and two correct calls for every round trip: when to leave and when to return. Time in the market asks for a target allocation, periodic rebalancing, and a tolerance for watching values fall without acting on it.