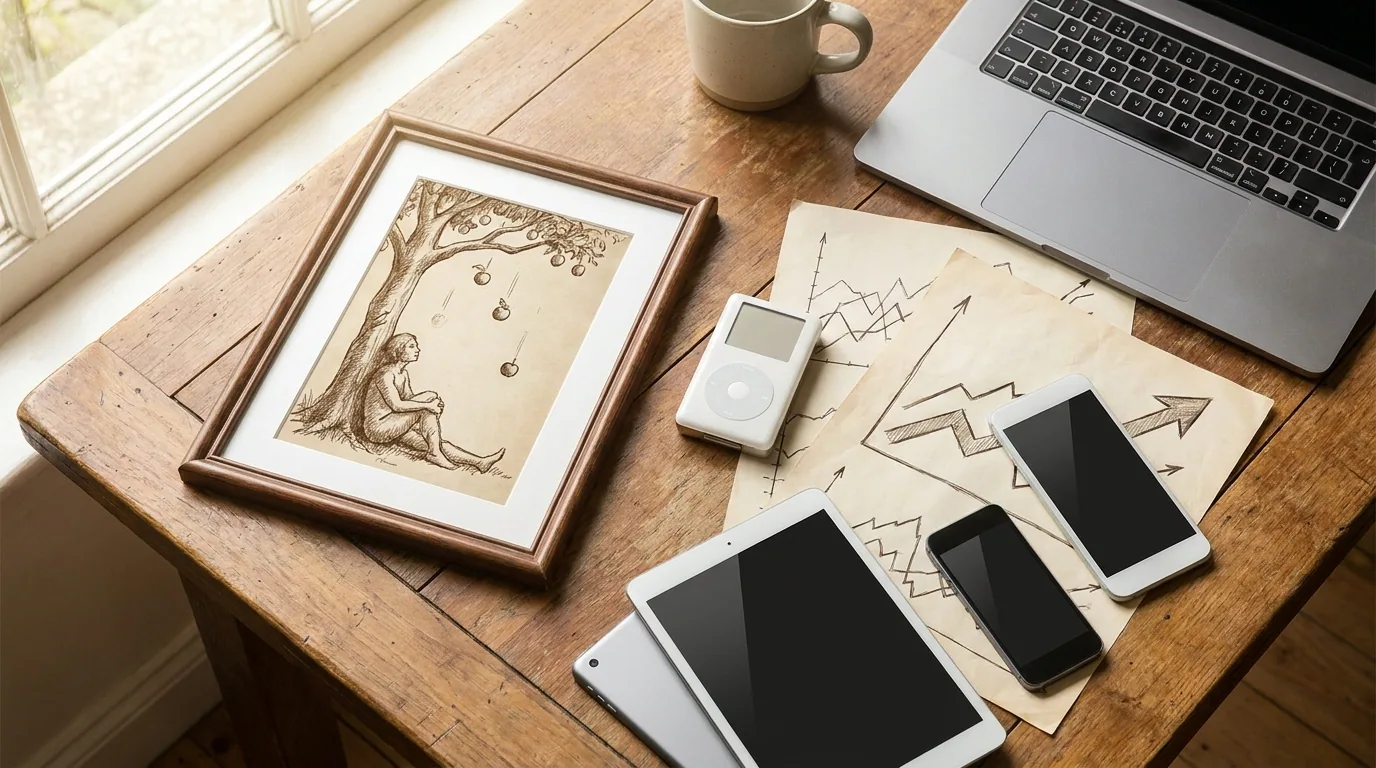
Windbreakers, a Wordsworth quote, and a $3 trillion valuation all belong to the same corporate history. The valuation is the part that gets written about.
Apple's first proposed logo showed Isaac Newton sitting beneath the tree, wrapped in a quote about him by the British poet William Wordsworth, with no apple silhouette anywhere in it.
Branded clothing came later. Meanwhile the business grew large enough that only a handful of national economies outranked it.
Apple Was the First Public Company to Cross $1 Trillion, $2 Trillion, and $3 Trillion
Apple's valuation passed $1 trillion in 2018, the first U.S. publicly traded company to reach that line. In 2020 it became the first to pass $2 trillion. At the very start of 2022, it briefly touched $3 trillion, another first.
| Milestone | Year reached |
|---|---|
| $1 trillion | 2018 |
| $2 trillion | 2020 |
| $3 trillion (briefly) | Start of 2022 |
Market cap is a live number that moves with the share price. Every valuation figure in an article like this one is a snapshot of a particular moment, not a fixed attribute of the company.
In 2022, Only Four Countries Had Economies Bigger Than Apple's Market Cap
At a market cap of $2.48 trillion, Apple was worth more than almost every national economy measured by GDP. In 2022, four countries came out ahead: the U.S., China, Germany, and Japan.
Comparing a company's market value to a country's annual output isn't an apples-to-apples measurement. One is the price investors put on future earnings, the other is a year of economic activity. It still gives a sense of the scale.
Apple's Profit Works Out to $1,752 per Second
Divide Apple's profit down to a single second and you get $1,752. No other global company earns at that pace. Walmart, Amazon, Bank of America, Facebook, Alphabet, and Microsoft all come in lower.
More Than Half of Revenue Still Comes From the iPhone
The iPhone launched in 2007. Fifteen years and a long list of new products later, iPhone sales still accounted for 52% of Apple's revenue. Cumulative sales reached 2.2 billion iPhones, with sales dipping only slightly during the COVID-19 crisis.
That concentration cuts both ways. When a single product line carries more than half the revenue, the release cycle of one device shapes the whole company's results.
Services Is the Next-Biggest Earner, at $68.4 Billion in 2021
The App Store and Apple Music drive most of the Services category, but the label covers more than music and apps. Cloud storage, AppleCare, Apple TV subscriptions, and other recurring products all sit inside it.
Services brought in $68.4 billion in 2021, against $192 billion in net iPhone sales in the same fiscal year.
Two Companies Turned Down the iPod Before Apple Took It
The iPod arrived in 2001, reshaped the music business, and gave a then-struggling Apple new momentum. Its creator, Tony Fadell, had already pitched his idea for a better MP3 player to Philips and to RealNetworks. Both passed.
What followed matters more than the near-miss. The iPod set up the iPhone, which Steve Jobs introduced as "a wide-screen iPod with touch controls."
Discontinued iPods Started Selling for Thousands on Resale Sites
Apple discontinued its last remaining iPod, the iPod Touch, in May 2022. Resale prices on eBay and comparable marketplaces climbed almost immediately, and some units changed hands for thousands of dollars.
Collector prices for old electronics are uneven, though. Two identical models can fetch very different amounts based on whether the battery still holds a charge, whether the original box and cable are included, and how many other sellers happen to be listing the same version that week. A headline sale price marks the top of a range rather than the going rate.
The Original Logo Featured Isaac Newton and a Wordsworth Quote
Before the apple silhouette, the company's planned mark was an illustration of Newton under the apple tree, a nod to his work on gravity, with a line about him from William Wordsworth.
It's a busy image for something meant to be printed small, and it goes some way toward explaining why logos tend to get simpler over time rather than more detailed.
Apple Leads Global Tablet Sales With More Than 30% of the Market
Apple held more than 30% of the global tablet market. Samsung, the next closest, held 18.1%. Profit is a separate question: the iPad isn't Apple's top earner.
| Company | Tablet market share | Tablets shipped in 2021 |
|---|---|---|
| Apple | More than 30% | 12.6 million |
| Samsung | 18.1% | 7.3 million |
Apple Credits Itself With More Than 2 Million U.S. Jobs
Count Apple's own employees plus third-party suppliers, manufacturers, and app developers, and the company is responsible for creating or contributing to more than 2 million jobs in the U.S.
The figure is broad by design: an independent developer selling one app is inside it, alongside people on Apple's payroll.
A 2017 Poll Put 2.6 Apple Products in the Average Household
More than 65% of Americans owned at least one Apple product, and households averaged 2.6 of them, according to a 2017 poll.
The average is easier to picture in a single home. Someone's current iPhone, an older iPhone kept as a spare, and an iPad that lives in a drawer already clears it, even in a household where the main computer runs Windows.
Apple Sold Apple-Branded Clothing in the 1980S
A year after Steve Jobs left Apple for the first time, the company put out a line of clothes inspired by its own products.
Windbreakers cut to '80s proportions, baseball caps, and thick sweaters for kids all carried the multicolored apple. The logo did the work; the clothes were mostly somewhere to put it.
The IMF Projected Apple Growing Faster Than the U.S. and Global Economies
In January 2022, the International Monetary Fund projected that Apple would grow faster than both the U.S. and the global economies over the following year.
Projections aren't outcomes, and Apple had not returned to the $3 trillion mark it briefly hit that January. Its valuation still sat well above Microsoft, Amazon, and Alphabet.
The Year Attached to Each Figure
Nearly every number above comes with a date, and the date does a lot of the work. The market cap milestones belong to 2018, 2020, and the first days of 2022.
The $68.4 billion in Services revenue and the 52% iPhone share are fiscal 2021 figures, as are the tablet shipment counts. The 2.6 products per household comes from a poll taken in 2017.
The IMF growth projection was published in January 2022 and looked one year ahead. Revenue and profit lines get restated with each new reporting period, and market cap is repriced every time the market opens.